The growing interest in metabolomic and exposomic studies is also inciting a need for new techniques to analyze these diverse molecules. Mass spectrometry-based studies are often preferred for the confident identification of small molecules. Ion mobility spectrometry (IMS) is capable of separating molecules that have the same m/z but different conformational arrangements, which is very useful in metabolomic and exposomic analyses. As the desire for IMS measurements of metabolites continues to grow, so does the need for high quality collision cross section (CCS) values.
Help
Dataset description
This website presents the collision cross section (CCS) measurement for metabolites and other small molecules. It displays information about various metabolites, including structure, mass, and CCS. The data can be downloaded as a TSV file or in a format compatible with the Agilent software suite for metabolite identification. We continue to analyze new molecules and the content of the website will be updated periodically to add them.
For a description of CCS and its use in metabolomics, see manuscript Dwivedi, P.; Wu, P.; Klopsch, S. J.; Puzon, G. J.; Xun, L.; Hill, H. H., Jr., Metabolic profiling by ion mobility mass spectrometry (IMMS). Metabolomics 2008, 4, (1), 63-80.
Filters and Sorting
Filters are a way to slim down the data in the table.
The pathway filter will filter the results of the table to show only metabolites located in that pathway.
Similarly the class and subclass filter will filter the results of the table to show only metabolites with that class or subclass.
However, you can choose multiple classes or subclasses. With each of the same type added to the filter it will add the metabolites found with that type.
That means it is an "or" operation, the metabolites that have this subclass or that subclass. An example would be Amino Acid and Fatty Acid in the filter;
it will show all metabolites that have amino acid or fatty acid as a subclass. The filtering between class and subclass is an "and" operation,
the metabolites that have this class and that subclass. An example would be Secondary Metabolite as the class and Amino Acid as the subclass; it will only show metabolites that
have both secondary metabolite as the class and amino acid as the subclass.
You can also type in a name, class, subclass, kegg id, cas number, formula, or exact mass into the search box. There are several ways to sort the data in the table, default it sorts the data based on class and subclass. Clicking on the class will change the order the class is sorted but, not the subclass. Clicking the subclass will do the same sorting based on subclass, but not class. You can also sort by name, cas number, formula, exact mass, and CCS. When sorting, any filters will affect the results of the ordering.
You can also type in a name, class, subclass, kegg id, cas number, formula, or exact mass into the search box. There are several ways to sort the data in the table, default it sorts the data based on class and subclass. Clicking on the class will change the order the class is sorted but, not the subclass. Clicking the subclass will do the same sorting based on subclass, but not class. You can also sort by name, cas number, formula, exact mass, and CCS. When sorting, any filters will affect the results of the ordering.
Pathway View
After selecting a pathway in the pathway filter you can click the show pathway button which will display a pathway with the current CCS data displayed on it. Red highlighting means
the molecule is found in that pathway, when you hover you can see the CCS values for that molecule. Applying other filters will also effect the results in the pathway view.
Downloading Data
Being able to download the data for this project is very important to us. We want everyone to use this data as a standard for identifying metabolites from the collision cross section.
To download the data click the download button and choose the formate that is appropriate for you. Simple, right?
There are two different formats available tsv, and Agilent. The tsv is the standard data format that is arranged for viewing in Excel with one row for each metabolite (see "Viewing" for import instructions). The Agilent format is presented as a tsv that can be directly imported into Agilent software suite.
There are also three ways to select which data is downloaded. The current page option will only download what is currently in the table. The current search option will download all the data that is from the search or filter, e.g. selecting a pathway, choosing a class, or typing in the search box. The last option is complete library, this is the current database.
Viewing
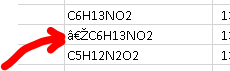
Opening the file directly with Excel could cause formating errors with the data. This could add unrecognized characters to show up, dates instead
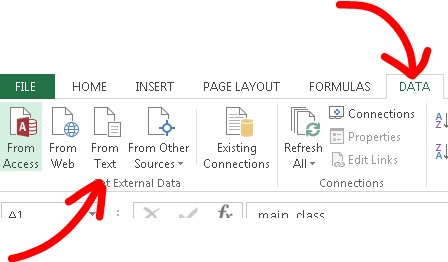
of cas id numbers, or other errors(fig 1). The best way to view the files in Excel is to open Excel, select data from the top tabs then select "from text" in the get external data area located on the left(fig 2).
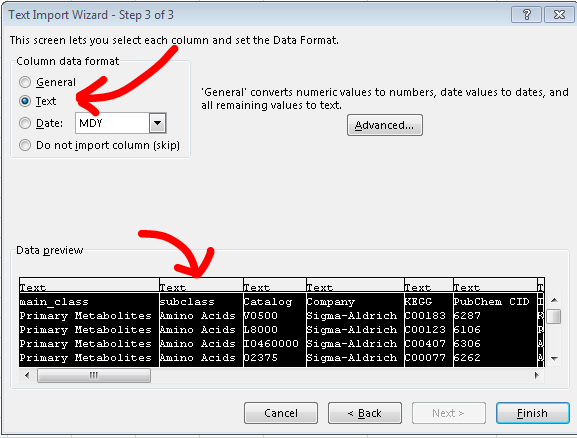
Then follow the import wizard until step 3, it asks for column data format. This is set to general by default, you must select all the columns in the preview window then change the data
format to text(fig 3).
Hover to enlarge image
Hover to enlarge image
Hover to enlarge image