6.1 Expression Heatmaps
A heatmap of the expression matrix of an MSnSet with features as rows and samples as columns. The data is assumed to be zero-centered. By default, row and column names are not shown. See ?complex_heatmap for how to change this.
# Base expression heatmap
complex_heatmap(m)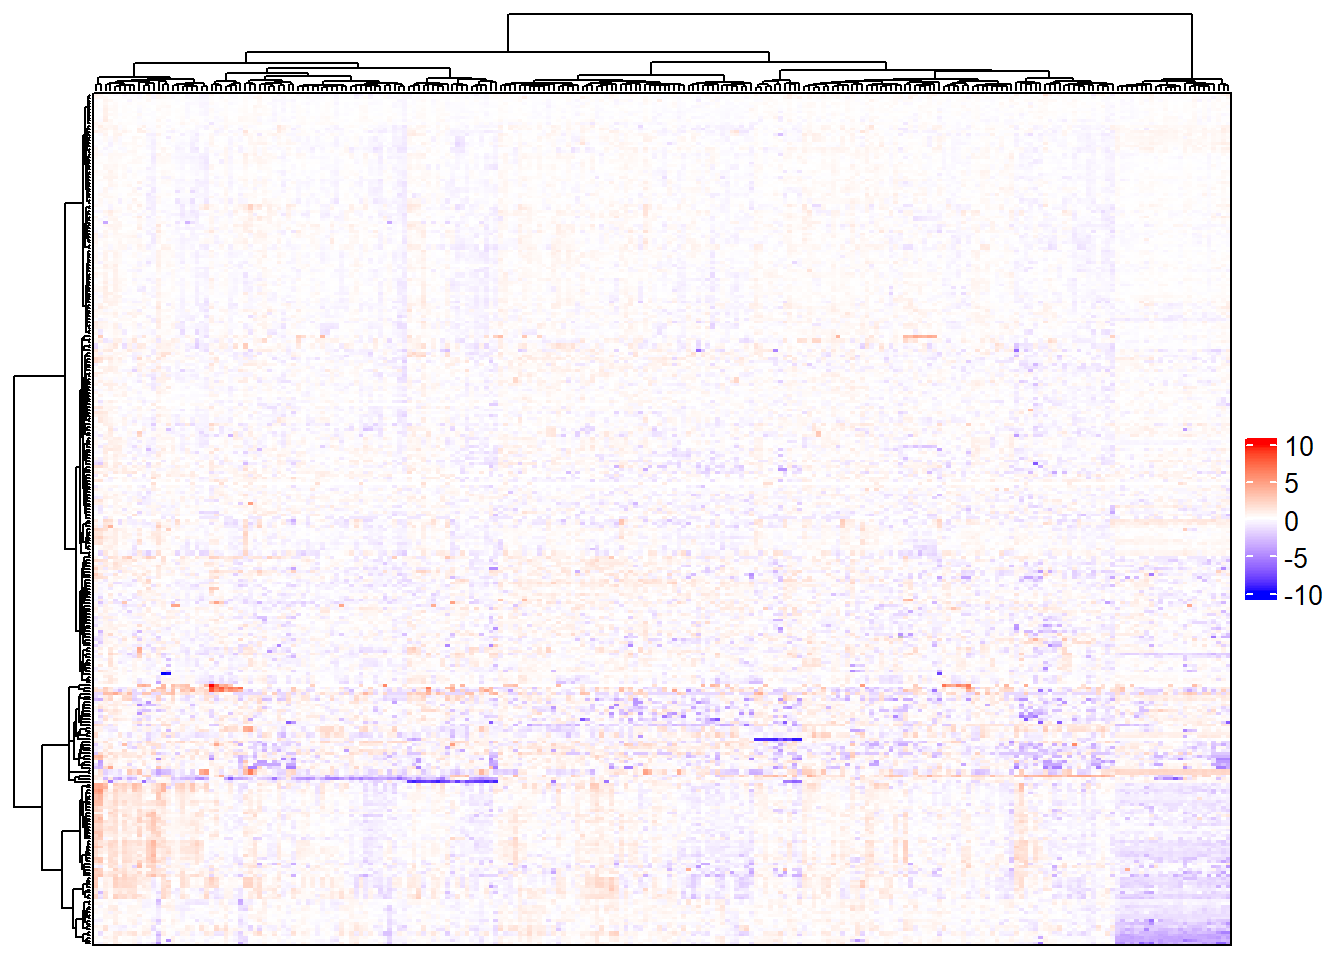
# Change color range to better detect patterns
complex_heatmap(m, color_range = c(-1.5, 1.5))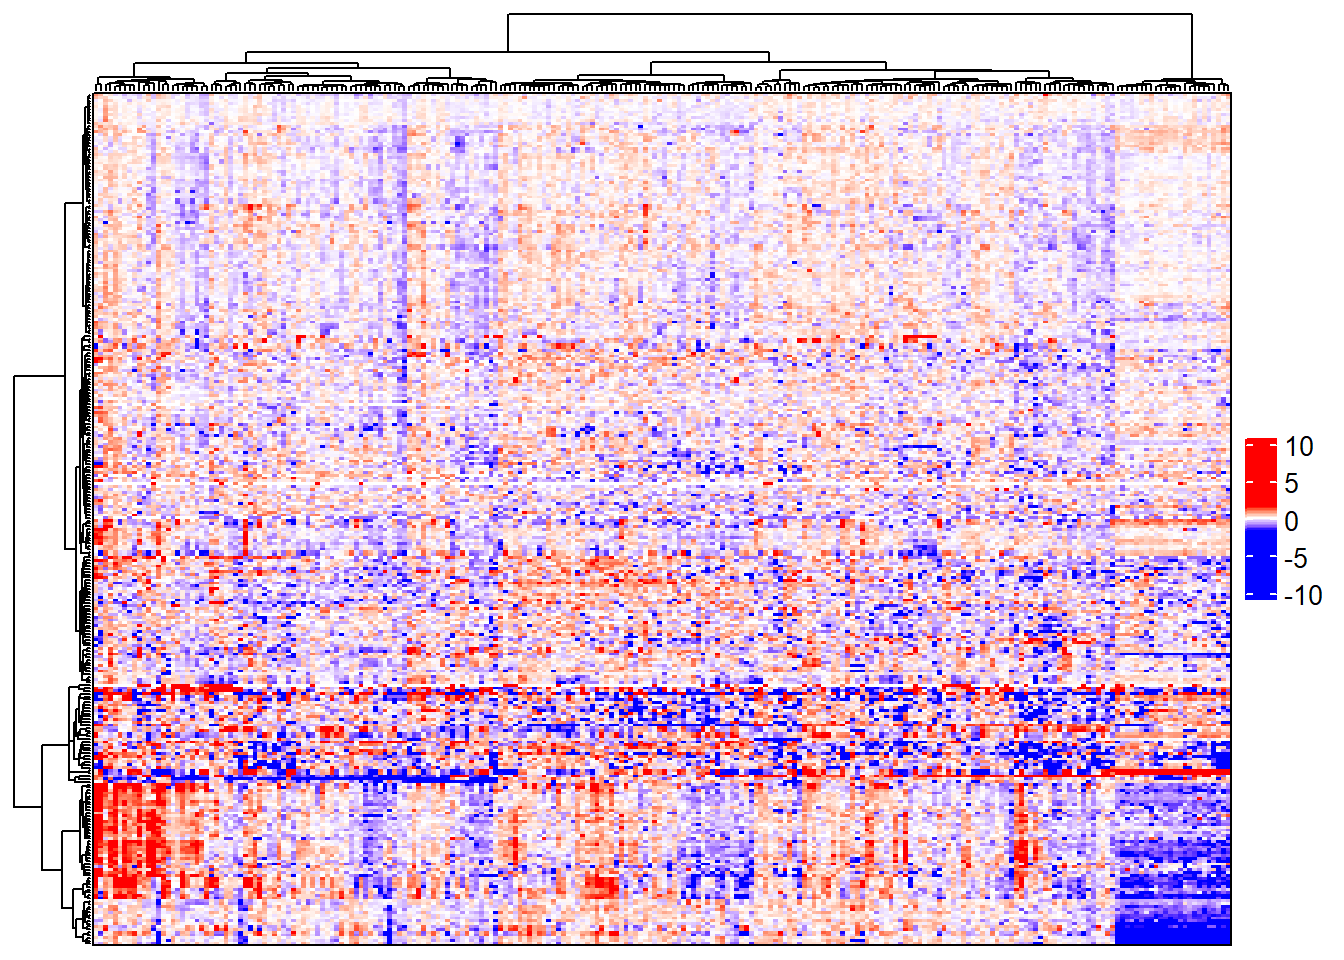
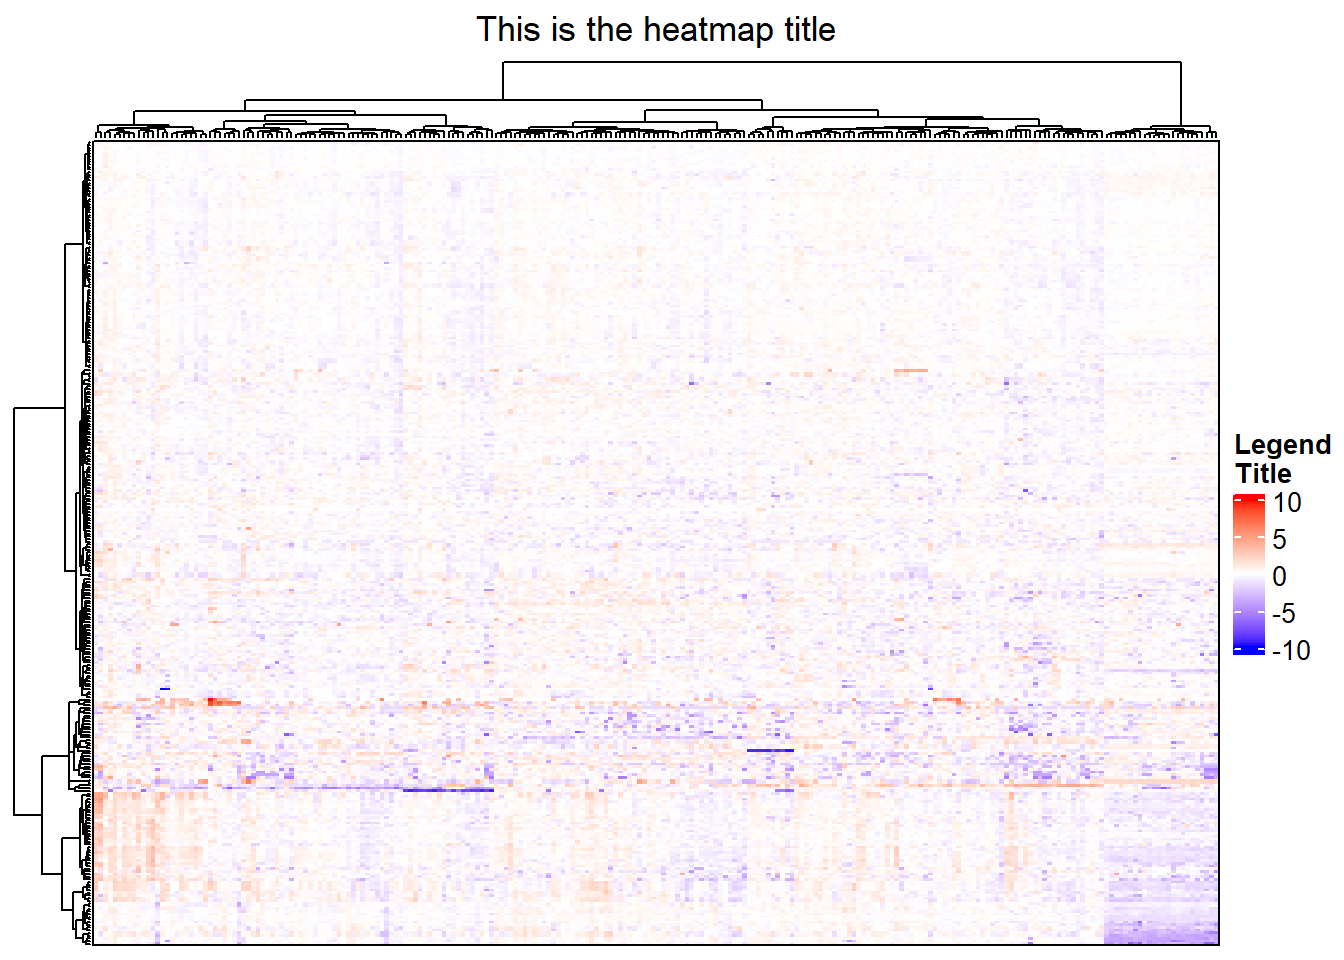
# Change heatmap title and legend title
complex_heatmap(m, heatmap_title = "This is the heatmap title",
                heatmap_legend_title = "Legend\nTitle")