1.3 Create Study Design Tables
To convert from PSMs and reporter ion intensities to meaningful quantitative data, it is necessary to specify the study design. The entire study design is captured by three tables: fractions, samples, and references. With newly processed data, these typically do not exist, and must be created. The next sections show how to create these tables in R.
NOTE: simple study designs can be created in Excel and read in with readxl::read_excel, though R is the better choice when dealing with many samples.
1.3.1 Fractions
The fractions table consists of two columns: Dataset and PlexID. The Dataset column contains all of the unique datasets that are common to msnid and masic_data. Sometimes, entire datasets may be removed during the FDR filtering steps, so that is why we use the unique intersection of datasets. The PlexID column contains the plex ID associated with each dataset, and is typically a letter followed by a number (“S1”, “S2”, etc.). A plex is a set of samples that are processed together (under the same conditions). Usually, we can extract the plex ID from the datasets. In this case, the plex ID always comes after “_W_”, so we can use a regular expression (use help(topic = regex, package = base) to learn more). The regular expression below says to capture an “S” followed by a single digit that appears after “_W_” and before an underscore. The plex ID is always included in the dataset names, but the format of the names will be different.
# Create fractions table
datasets <- unique(intersect(msnid$Dataset, masic_data$Dataset))
fractions <- data.frame(Dataset = datasets) %>%
mutate(PlexID = gsub(".*_W_(S\\d{1})_.*", "\\1", Dataset))| Dataset | PlexID |
|---|---|
| MoTrPAC_Pilot_TMT_W_S1_07_12Oct17_Elm_AQ-17-09-02 | S1 |
| MoTrPAC_Pilot_TMT_W_S2_06_12Oct17_Elm_AQ-17-09-02 | S2 |
| MoTrPAC_Pilot_TMT_W_S2_07_12Oct17_Elm_AQ-17-09-02 | S2 |
| MoTrPAC_Pilot_TMT_W_S2_05_12Oct17_Elm_AQ-17-09-02 | S2 |
| MoTrPAC_Pilot_TMT_W_S1_24_12Oct17_Elm_AQ-17-09-02 | S1 |
| MoTrPAC_Pilot_TMT_W_S2_08_12Oct17_Elm_AQ-17-09-02 | S2 |
| MoTrPAC_Pilot_TMT_W_S1_16_12Oct17_Elm_AQ-17-09-02 | S1 |
| MoTrPAC_Pilot_TMT_W_S2_16_12Oct17_Elm_AQ-17-09-02 | S2 |
| MoTrPAC_Pilot_TMT_W_S2_23_12Oct17_Elm_AQ-17-09-02 | S2 |
| MoTrPAC_Pilot_TMT_W_S1_15_12Oct17_Elm_AQ-17-09-02 | S1 |
| MoTrPAC_Pilot_TMT_W_S2_09_12Oct17_Elm_AQ-17-09-02 | S2 |
| MoTrPAC_Pilot_TMT_W_S1_17_12Oct17_Elm_AQ-17-09-02 | S1 |
| MoTrPAC_Pilot_TMT_W_S1_08_12Oct17_Elm_AQ-17-09-02 | S1 |
| MoTrPAC_Pilot_TMT_W_S1_23_12Oct17_Elm_AQ-17-09-02 | S1 |
| MoTrPAC_Pilot_TMT_W_S2_22_12Oct17_Elm_AQ-17-09-02 | S2 |
| MoTrPAC_Pilot_TMT_W_S1_01_12Oct17_Elm_AQ-17-09-02 | S1 |
| MoTrPAC_Pilot_TMT_W_S2_24_12Oct17_Elm_AQ-17-09-02 | S2 |
| MoTrPAC_Pilot_TMT_W_S1_05_12Oct17_Elm_AQ-17-09-02 | S1 |
| MoTrPAC_Pilot_TMT_W_S1_04_12Oct17_Elm_AQ-17-09-02 | S1 |
| MoTrPAC_Pilot_TMT_W_S2_04_12Oct17_Elm_AQ-17-09-02 | S2 |
| MoTrPAC_Pilot_TMT_W_S1_02_12Oct17_Elm_AQ-17-09-02 | S1 |
| MoTrPAC_Pilot_TMT_W_S2_01_12Oct17_Elm_AQ-17-09-02 | S2 |
| MoTrPAC_Pilot_TMT_W_S1_13_12Oct17_Elm_AQ-17-09-02 | S1 |
| MoTrPAC_Pilot_TMT_W_S2_12_12Oct17_Elm_AQ-17-09-02 | S2 |
| MoTrPAC_Pilot_TMT_W_S1_03_12Oct17_Elm_AQ-17-09-02 | S1 |
| MoTrPAC_Pilot_TMT_W_S2_03_12Oct17_Elm_AQ-17-09-02 | S2 |
| MoTrPAC_Pilot_TMT_W_S1_18_12Oct17_Elm_AQ-17-09-02 | S1 |
| MoTrPAC_Pilot_TMT_W_S2_18_12Oct17_Elm_AQ-17-09-02 | S2 |
| MoTrPAC_Pilot_TMT_W_S1_20_12Oct17_Elm_AQ-17-09-02 | S1 |
| MoTrPAC_Pilot_TMT_W_S1_06_12Oct17_Elm_AQ-17-09-02 | S1 |
| MoTrPAC_Pilot_TMT_W_S1_21_12Oct17_Elm_AQ-17-09-02 | S1 |
| MoTrPAC_Pilot_TMT_W_S1_10_12Oct17_Elm_AQ-17-09-02 | S1 |
| MoTrPAC_Pilot_TMT_W_S1_19_12Oct17_Elm_AQ-17-09-02 | S1 |
| MoTrPAC_Pilot_TMT_W_S2_15_12Oct17_Elm_AQ-17-09-02 | S2 |
| MoTrPAC_Pilot_TMT_W_S2_17_12Oct17_Elm_AQ-17-09-02 | S2 |
| MoTrPAC_Pilot_TMT_W_S1_12_12Oct17_Elm_AQ-17-09-02 | S1 |
| MoTrPAC_Pilot_TMT_W_S1_14_12Oct17_Elm_AQ-17-09-02 | S1 |
| MoTrPAC_Pilot_TMT_W_S2_13_12Oct17_Elm_AQ-17-09-02 | S2 |
| MoTrPAC_Pilot_TMT_W_S2_14_12Oct17_Elm_AQ-17-09-02 | S2 |
| MoTrPAC_Pilot_TMT_W_S1_09_12Oct17_Elm_AQ-17-09-02 | S1 |
| MoTrPAC_Pilot_TMT_W_S1_11_12Oct17_Elm_AQ-17-09-02 | S1 |
| MoTrPAC_Pilot_TMT_W_S1_22_12Oct17_Elm_AQ-17-09-02 | S1 |
| MoTrPAC_Pilot_TMT_W_S2_10_12Oct17_Elm_AQ-17-09-02 | S2 |
| MoTrPAC_Pilot_TMT_W_S2_11_12Oct17_Elm_AQ-17-09-02 | S2 |
| MoTrPAC_Pilot_TMT_W_S2_19_12Oct17_Elm_AQ-17-09-02 | S2 |
| MoTrPAC_Pilot_TMT_W_S2_20_12Oct17_Elm_AQ-17-09-02 | S2 |
| MoTrPAC_Pilot_TMT_W_S2_21_12Oct17_Elm_AQ-17-09-02 | S2 |
| MoTrPAC_Pilot_TMT_W_S2_02_12Oct17_Elm_AQ-17-09-02 | S2 |
1.3.2 Samples
The samples table contains columns PlexID, QuantBlock, ReporterName, ReporterAlias, and MeasurementName.
PlexIDmust be the same as thePlexIDin the fractions table.ReporterNameis the reporter ion name (“126”, “127N”, “127C”, etc.).ReporterAliasis used for defining the reference channel(s).MeasurementNamedetermines the column names for the final cross-tab, and must be unique and begin with a letter. If any values ofReporterAliasare “ref”, the correspondingMeasurementNameshould beNA.NAmeasurement names will not appear as columns in the final cross-tab.QuantBlockdefines the sub-plex. In a typical TMT experiment,QuantBlockis always 1. In case of 5 pairwise comparisons within TMT10, there will be 5 QuantBlocks (1-5) potentially with a reference for eachQuantBlock.
For this experiment, TMT10 was used as the basis for two plexes, and channel 131 is the reference, so we set ReporterAlias to “ref” and MeasurementName to NA when ReporterName is "131". This will divide the intensities of each channel by their associated reference and make the reference channel absent from the quantitative cross-tab. In cases where reporter ion intensities are not normalized by a reference channel (reference = 1) or they are normalized by the average of select channels, do not set any ReporterAlias to “ref” or MeasurementName to NA.
# Create samples table
samples <- reporter_converter$tmt10 %>%
  dplyr::select(ReporterName) %>% # only keep ReporterName column
  dplyr::slice(rep(1:n(), times = 2)) %>% # Copy TMT10 table twice (2 plexes)
  # Create PlexID and QuantBlock columns.
  # Plex S1 goes with first 10 rows, plex S2 with last 10
  mutate(PlexID = paste0("S", rep(1:2, each = 10)),
         QuantBlock = 1) %>%
  group_by(PlexID) %>%
  # Within each of the two PlexID groups, create unique reporter aliases
  # and measurement names. ReporterAlias is "ref" for channel 131,
  # and MeasurementName is NA so it is not included in the cross-tab.
  mutate(ReporterAlias = paste(PlexID, 1:n(), sep = "_"),
         ReporterAlias = ifelse(ReporterName == "131", "ref", ReporterAlias),
         MeasurementName = ifelse(ReporterName == "131", NA, ReporterAlias)) %>%
ungroup() # stop grouping by PlexID| ReporterName | PlexID | QuantBlock | ReporterAlias | MeasurementName |
|---|---|---|---|---|
| 126 | S1 | 1 | S1_1 | S1_1 |
| 127N | S1 | 1 | S1_2 | S1_2 |
| 127C | S1 | 1 | S1_3 | S1_3 |
| 128N | S1 | 1 | S1_4 | S1_4 |
| 128C | S1 | 1 | S1_5 | S1_5 |
| 129N | S1 | 1 | S1_6 | S1_6 |
| 129C | S1 | 1 | S1_7 | S1_7 |
| 130N | S1 | 1 | S1_8 | S1_8 |
| 130C | S1 | 1 | S1_9 | S1_9 |
| 131 | S1 | 1 | ref | NA |
| 126 | S2 | 1 | S2_1 | S2_1 |
| 127N | S2 | 1 | S2_2 | S2_2 |
| 127C | S2 | 1 | S2_3 | S2_3 |
| 128N | S2 | 1 | S2_4 | S2_4 |
| 128C | S2 | 1 | S2_5 | S2_5 |
| 129N | S2 | 1 | S2_6 | S2_6 |
| 129C | S2 | 1 | S2_7 | S2_7 |
| 130N | S2 | 1 | S2_8 | S2_8 |
| 130C | S2 | 1 | S2_9 | S2_9 |
| 131 | S2 | 1 | ref | NA |
Table 1.5 shows the samples table.
1.3.3 References
The reference can be a certain channel, the geometric average of channels, 1 (no reference), or an R expression that evaluates to a vector. The general form is an expression with ReporterAlias names as variables. It is evaluated for each PlexID/QuantBlock combination and applied to divide reporter ion intensities within corresponding PlexID/QuantBlock. A reference is used to convert raw intensities to relative intensities.
# Create references table
references <- samples %>%
  filter(ReporterAlias == "ref") %>%
  # Select required columns and rename ReporterAlias to Reference
select(PlexID, QuantBlock, Reference = ReporterAlias)| PlexID | QuantBlock | Reference |
|---|---|---|
| S1 | 1 | ref |
| S2 | 1 | ref |
Table 1.6 shows the references table. The code to use the geometric average instead of a single channel as the reference is shown below. The geometric average is the product of the reporter ion channels to the power of (1/number of channels). For each PlexID group, collapse the vector of reporter ion names with *, surround them in parentheses, and raise to the power of (1/number of channels).
Note: If the reference is not a particular channel that will be excluded from the final results, there should not be any ReporterAlias that are “ref” or MeasurementName that are NA.
## Example of how to use the geometric average as reference - not run
references <- samples %>%
  group_by(PlexID, QuantBlock) %>%
  summarise(Reference = sprintf("(%s)^(1/%d)",
                                paste(ReporterAlias, collapse = "*"),
                                n()),
            .groups = "keep")
## Example of how to set the reference to 1 - not run
references <- samples %>%
distinct(PlexID, QuantBlock) %>%
mutate(Reference = 1)Now that we have the three study design tables, we should save them.
# Save study design tables with write.table
write.table(fractions, file = "data/3442_fractions.txt",
            sep = "\t", quote = FALSE, row.names = FALSE)
write.table(samples, file = "data/3442_samples.txt",
            sep = "\t", quote = FALSE, row.names = FALSE)
write.table(references, file = "data/3442_references.txt",
            sep = "\t", quote = FALSE, row.names = FALSE)
Once the study design tables have been saved to text files, it is good practice to make them available to others. To do so, navigate to the Share Path provided in the DMS Data Package Detail Report (shown in Figure 1.7), and copy the three study design files to this location. This allows them to be accessed by others with the get_study_design_by_dataset_package function in the future.
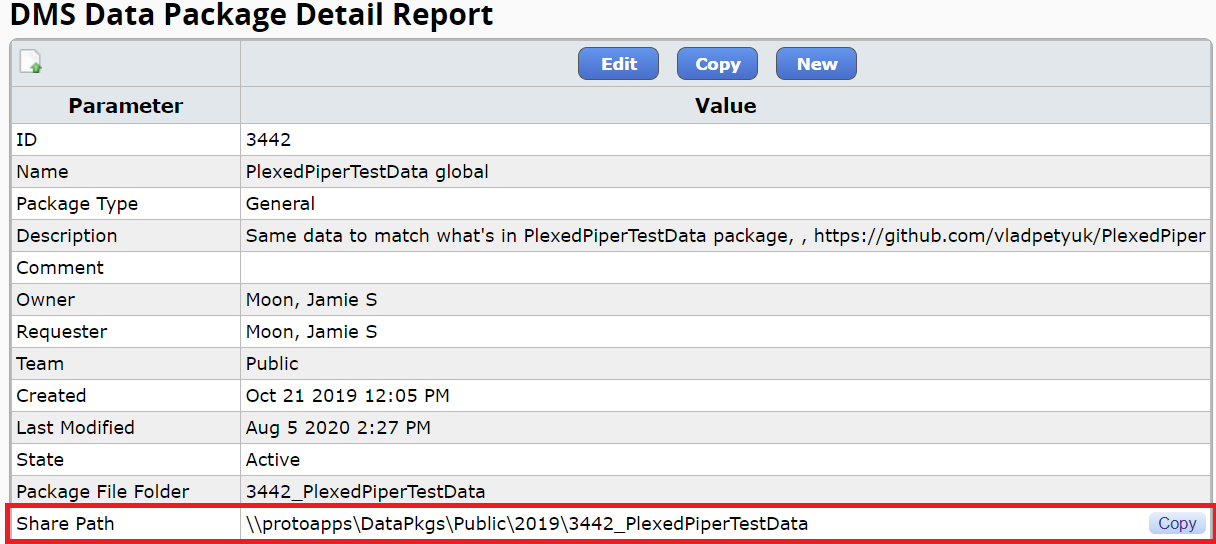
Figure 1.7: Location of the Share Path used to add the study design tables.